
How to Read a Bunker Sand Lab Report: A Worked Guide
Quick answer: To read a bunker sand lab report, check silt and clay first (lower is better), then confirm at least 65% of particles fall between 0.25 and 1.0 mm. Use D85 to check compatibility with gravel layers, Cu to judge uniformity, and penetrometer, crusting and infiltration data to predict lies and drainage. Jackson Sand's West Tennessee bunker sands serve as worked examples.
Why the Lab Report Is the Real Product
A pile of bunker sand tells you almost nothing. Two sands can look the same in the yard and behave completely differently once they are raked into a bunker and rained on. One drains in minutes and holds a ball up. The other crusts, stays wet and buries every soft landing. The lab report is how you tell them apart before you spend money on trucking, labor and installation.
Golf course agronomists commonly evaluate bunker sand on seven factors:
- Particle size
- Particle shape and penetrometer value
- Crusting potential
- Chemical reaction (pH) and hardness
- Infiltration rate
- Color
- Overall playing quality
Most of those show up as numbers on a physical soil test, and they should come from an accredited physical soil testing laboratory, not from a supplier’s estimate or a quick jar test. This guide explains how to read each part of a bunker sand report, using the published reports for Jackson Sand’s Regular Bunker Sand and Tennessee White Bunker Sand as worked examples. Both products are made at Jackson Sand’s plant in Jackson, Tennessee for courses across West Tennessee and the Mid-South, and both reports are available on the sand specs page if you want to follow along with the originals.
The goal is not to turn you into a soil scientist. It is to let you look at any bunker sand report, from any supplier, and know within a couple of minutes whether the sand is worth a closer look.
The Size Classes on a Sand Report
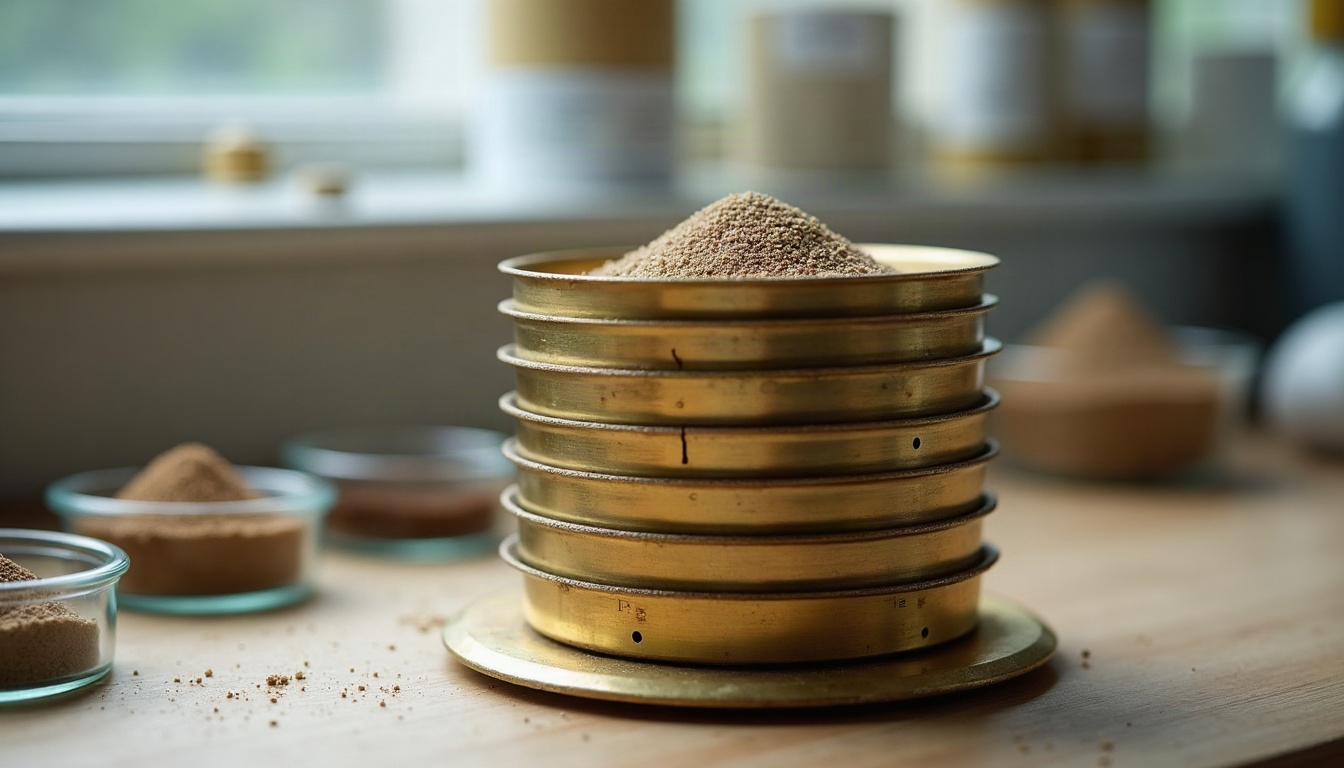
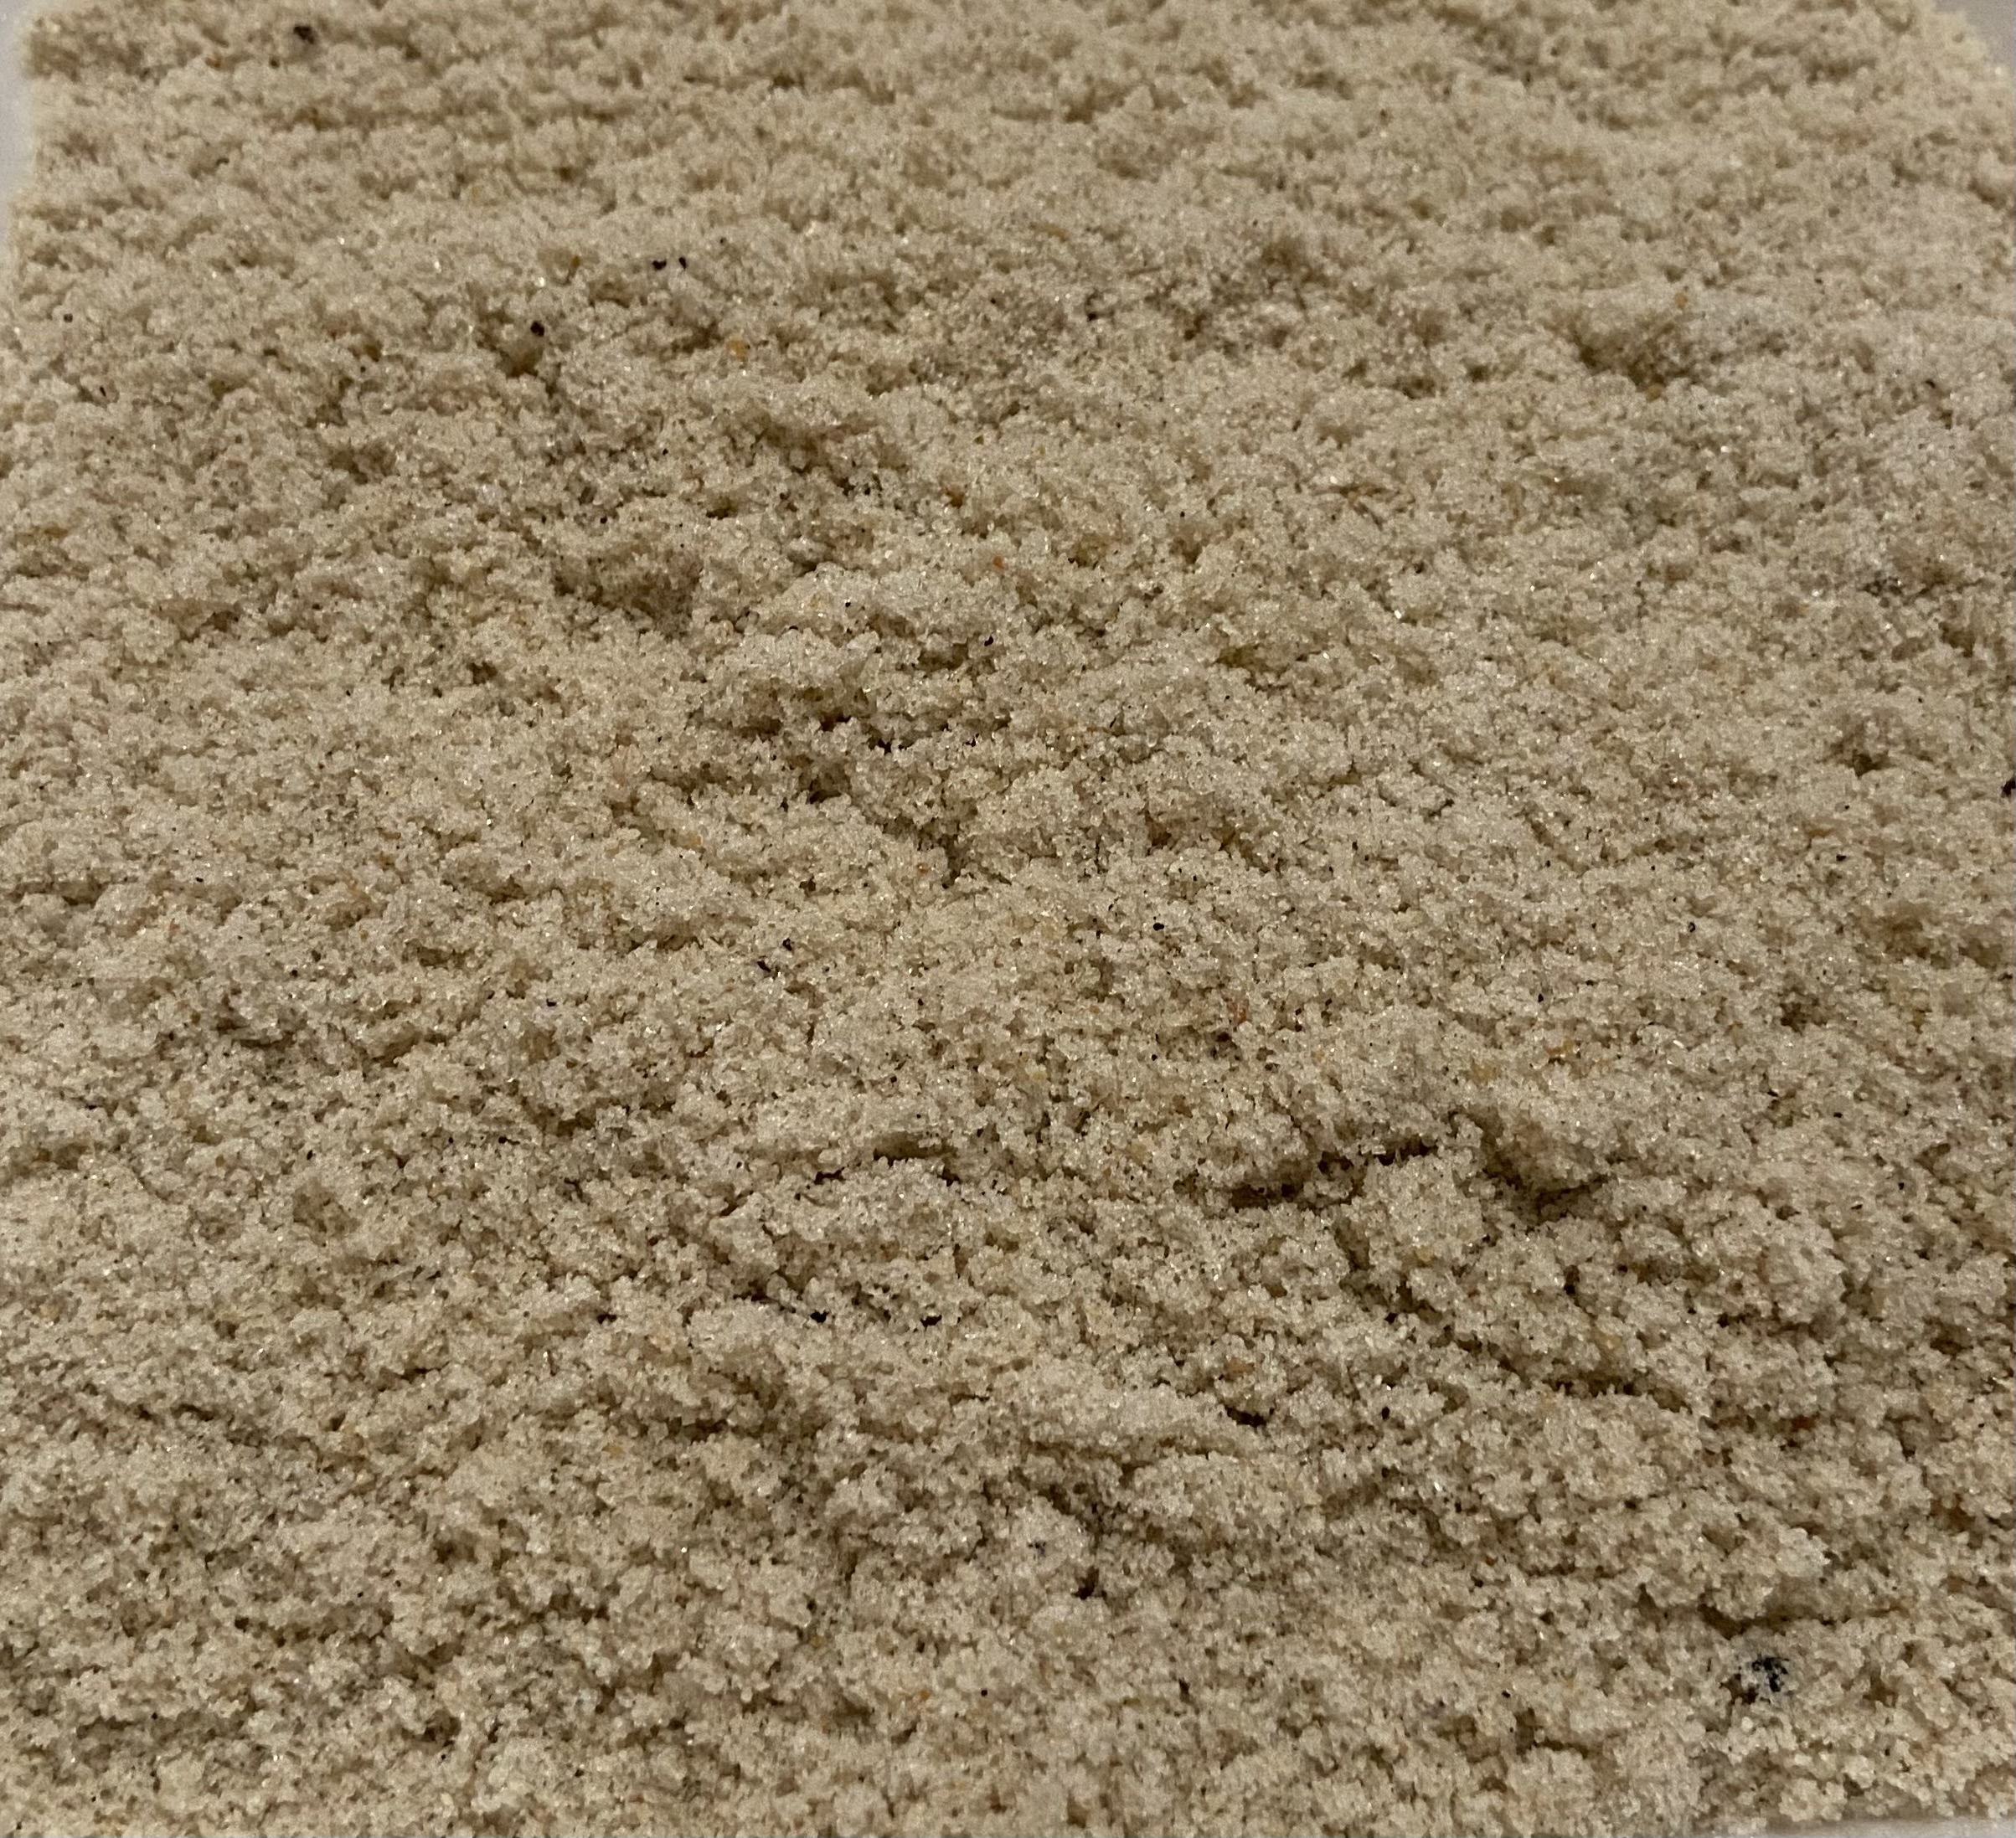
Every report starts with a particle size analysis. A dried sample is shaken through a stack of sieves, and the weight retained on each one is reported as a percentage of the whole. Silt and clay are too fine for sieves and are measured by sedimentation. The classes used for golf course sands look like this:
| Class | Diameter | Regular Bunker Sand | Tennessee White |
|---|---|---|---|
| Gravel | over 2.0 mm | 0.1% | 0.1% |
| Very coarse sand | 1.0 to 2.0 mm | 1.5% | 2.1% |
| Coarse sand | 0.5 to 1.0 mm | 10.7% | 22.8% |
| Medium sand | 0.25 to 0.5 mm | 67.9% | 50.7% |
| Fine sand | 0.15 to 0.25 mm | 18.0% | 22.3% |
| Very fine sand | 0.05 to 0.15 mm | 1.3% (1.1% + 0.2%) | 1.7% |
| Silt | 0.002 to 0.05 mm | under 1.0% | 0.2% |
| Clay | under 0.002 mm | under 1.0% | 0.1% |
Two practical notes on reading this table. First, labs do not always use identical sieve breaks. Jackson Sand’s Regular Bunker Sand report splits the fine range at 0.10 mm, listing 1.1% at 0.10 mm and 0.2% at 0.05 mm. When comparing reports, add classes together so the boundaries match. Second, the columns should add up to roughly 100%. If they do not, ask why before you rely on the numbers.
The rest of the report builds on this table, so it is worth getting comfortable with it.
Total Sand, Silt and Clay: Read the Bottom First
Experienced superintendents usually read a bunker sand report from the bottom up. Silt and clay are where most bunker problems start, so they are the first numbers to check.
What fines do in a bunker
- Crusting. After rain, silt and clay wash to the surface or settle a short distance down, then dry into a skin that deflects the ball and changes how sand feels under the club.
- Slow drainage. Fines lodge in pore spaces and plug the path water takes to the drain.
- Staining. Clay discolors sand and smears on balls. On white sand, it is the fastest way to lose the look you paid for.
- Drain clogging. Fines that move through the profile eventually reach the gravel and pipe.
Worked example
Regular Bunker Sand reports 99.3% sand with less than 1.0% silt and less than 1.0% clay. Tennessee White reports 99.6% sand with 0.2% silt and 0.1% clay. Both are very clean. Tennessee White’s 0.3% combined fines is exceptionally low, which suits a sand whose value depends on staying bright.
What to look for on any report
Lower is always better for silt and clay in a bunker. Low single-digit combined fines are a common ceiling in specs, and premium sands come in well below that. If a report shows several percent of silt and clay, expect crusting and slower infiltration within a season or two.
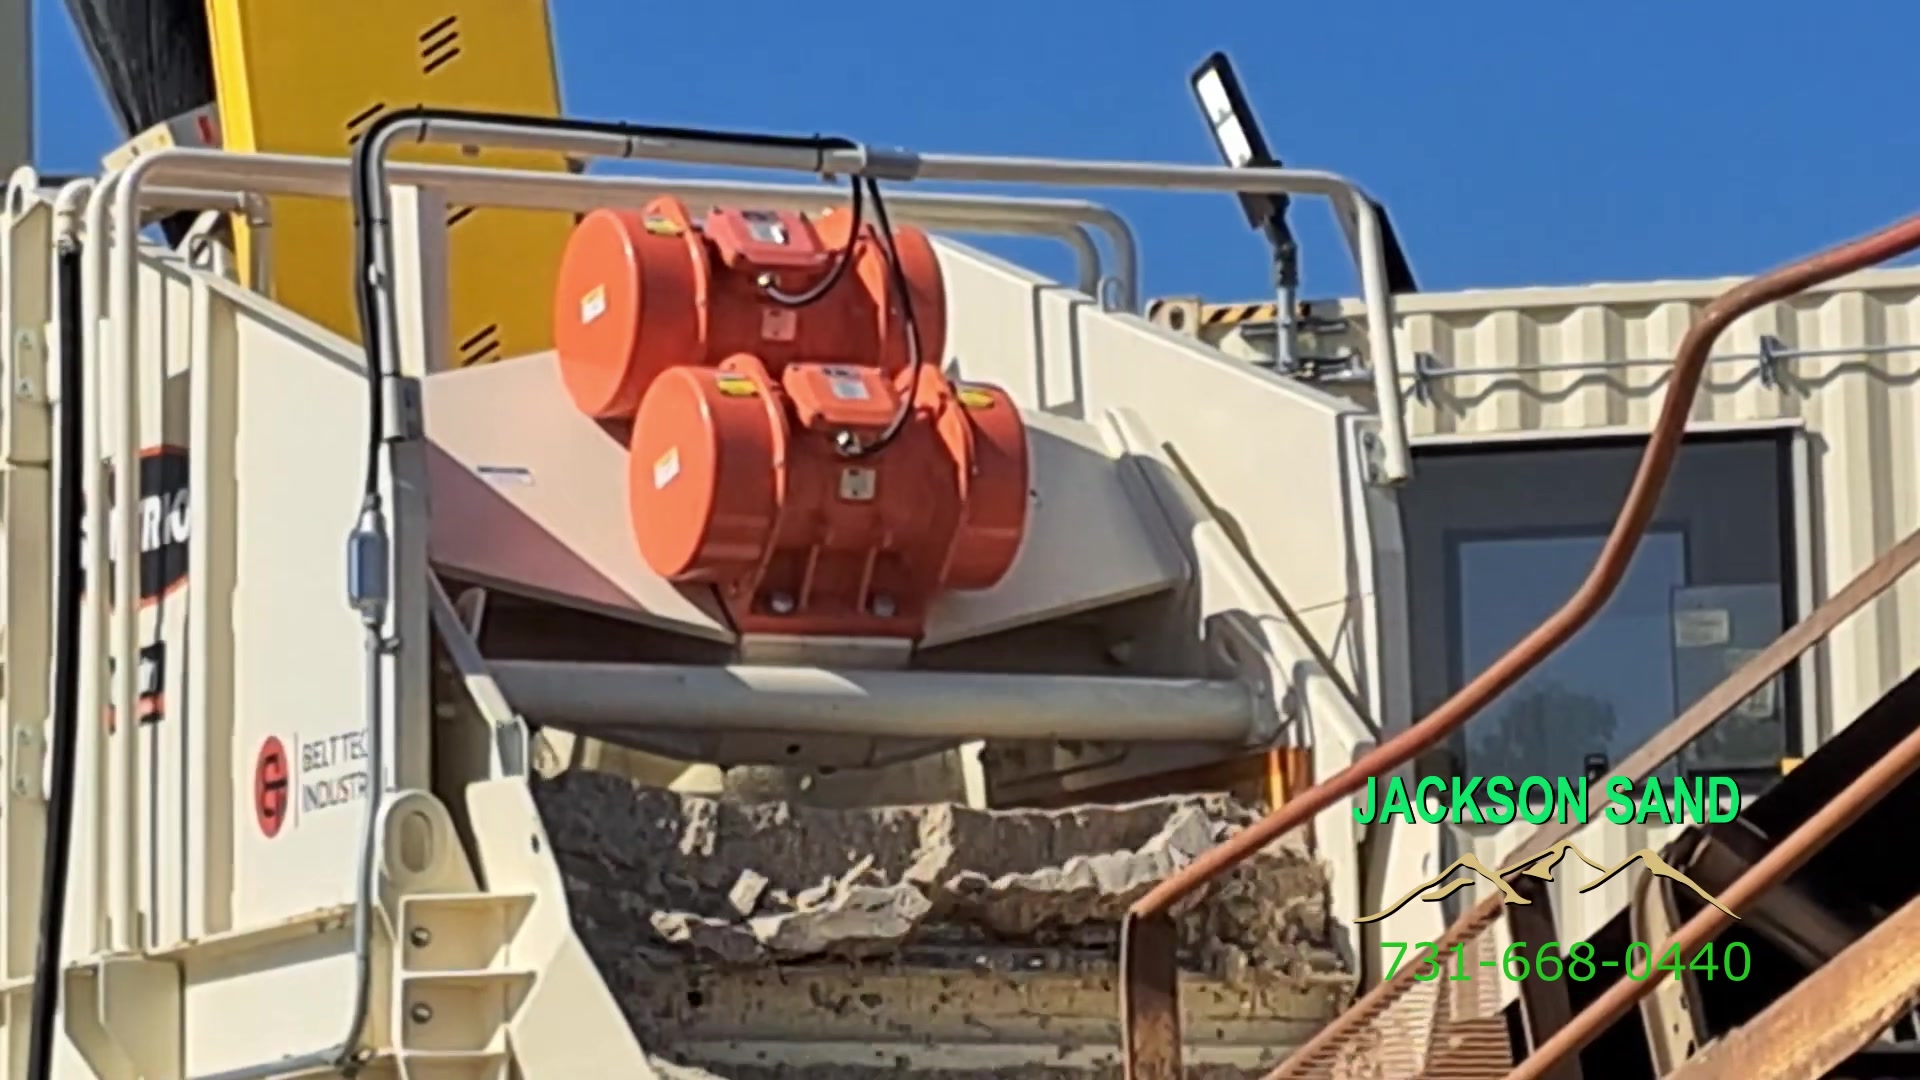
Fines are largely a function of processing. Jackson Sand runs its sand through a washing plant with screw classifiers and vibrating dewatering screens, which is how washed sand gets its silt and clay stripped out before it ever reaches a stockpile.
Particle Size Fractions and the 65% Guideline
Once fines check out, look at where the sand particles sit. The single most useful calculation is the share of particles between 0.25 and 1.0 mm, meaning medium plus coarse sand. Bunker sand guidance commonly calls for at least 65% in that range.
Why that range
Particles in this window are big enough to leave open pores for fast drainage and small enough to give a soft, raked texture that plays well. Below 0.25 mm, sand starts to pack, hold water and blow around. Above 1.0 mm, it feels stony, scatters onto greens and can scratch clubs.
Worked example
- Regular Bunker Sand: 10.7% coarse + 67.9% medium = 78.6%
- Tennessee White: 22.8% coarse + 50.7% medium = 73.5%
Both clear the 65% benchmark comfortably. The more interesting information is how they reach it. Regular is medium-heavy, with a modest coarse fraction. Tennessee White splits more evenly between coarse and medium, with a slightly larger fine fraction underneath.
Check the tails
Then look at both ends. At the top, gravel plus very coarse sand is 1.6% for Regular and 2.2% for Tennessee White, both low. At the bottom, very fine sand is 1.3% and 1.7%. Fine sand (0.15 to 0.25 mm) is 18.0% and 22.3%. Some fine sand helps firm the surface; very fine sand mostly slows drainage, so you want that class small.
A contrast: why top dressing is different
Compare Jackson Sand’s Champion top dressing, built for ultradwarf bermudagrass greens: 13.9% medium, 55.8% fine and 30.3% very fine sand. It is engineered to work into a tight putting surface and spare mower reels, which is exactly what you do not want in a bunker. Reading the size fractions is how you keep products like these in the right place. The top dressing page lists those products.
D-Values: D85, D60 and D10
D-values compress the whole size curve into a few numbers. “D” followed by a number is the particle diameter that that percentage of the sample, by weight, is finer than.
- D10: 10% of the sample is finer than this size. It reflects the fine end, which controls how small the pores get.
- D60: 60% is finer than this size. It sits near the middle of the distribution.
- D85: 85% is finer than this size. It describes the coarse end.
Worked example: D85 = 0.49 mm
Regular Bunker Sand’s report lists a D85 of 0.49 mm. You can sanity-check that against the table. Gravel, very coarse and coarse sand together are 12.3%, so about 87.7% of the sample is finer than 0.5 mm. That means the 85% point should fall just under 0.5 mm, and 0.49 mm does. Doing this quick check on any report helps you catch typos and mismatched data.
Why designers care about D85
D85 matters when sand sits over a gravel layer, as it does in many modern bunker liner and drainage systems. The question is whether sand will wash down into the gravel. Golf construction borrows the bridging rule from USGA putting green guidance: the gravel’s D15 should be no more than about five times the D85 of the material above it. For Regular Bunker Sand, 5 x 0.49 mm gives a maximum gravel D15 of about 2.45 mm. Your architect or liner manufacturer makes the final call, but D85 is the number they will ask for.
The Tennessee White report quoted here does not list D-values. If your spec needs them, request the complete current report rather than estimating from the size table. For background on gravel layers and drainage below the surface, Jackson Sand’s guides to seepage drainage and gravels are useful companions.
The Uniformity Coefficient (Cu)
The uniformity coefficient is a simple ratio: Cu = D60 / D10. It tells you how spread out the particle sizes are.
- A Cu close to 1 means nearly every grain is the same size.
- A Cu around 2 describes a fairly uniform sand.
- Higher values indicate a broader, more well-graded sand where small grains fill gaps between large ones.
How Cu affects a bunker
Uniform sands, with low Cu, leave open, connected pores. They drain fast and rake smoothly, but grains do not interlock as much, so the surface tends to be softer. Broadly graded sands, with higher Cu, pack more tightly. That can firm the surface and reduce buried lies, but too much packing slows drainage and can make a bunker feel hard.
Worked example: Cu = 2.0
Regular Bunker Sand reports a Cu of 2.0. You can see why from the size table: D10 falls somewhere in the fine sand class and D60 in the medium class, so the ratio between them is small. The sand is medium-centered and uniform, which matches its reputation for consistent, easy-raking bunkers.
Tennessee White’s broader distribution, with roughly 23% coarse, 51% medium and 22% fine sand, would be expected to produce a somewhat higher Cu, though the report quoted here does not list one. That broader grading is part of why it tends to play firmer.
Reading Cu alongside the fines
A higher Cu is only helpful if the small particles doing the filling are real sand, not silt and clay. Always read Cu together with the fines numbers. A broadly graded sand with very low silt and clay can be firm and fast draining. A broadly graded sand with high fines is a recipe for a hard, wet bunker.
Particle Shape, Penetrometer Values and Fried-Egg Lies
Size is half the story. Shape is the other half, and it shows up in the penetrometer value.
Particle shape
Labs rate shape on two scales: sphericity, meaning how round the overall grain is, and angularity, meaning how sharp its edges are. Angular grains lock together and resist displacement, producing a firmer surface. Rounded grains roll past each other, producing a softer, looser surface that buries balls more easily. Most specifiers prefer sands that are angular to subangular for bunkers.
Penetrometer value
A penetrometer measures how much force it takes to push a probe into a prepared sample of sand, typically reported in kilograms per square centimeter. It is the lab’s stand-in for the question golfers actually ask: will my ball plug?
- Lower readings mean softer sand and a greater tendency toward buried and fried-egg lies.
- Higher readings mean a firmer surface that holds the ball up.
As a rough guide used in the industry, values below about 2.2 kg/cm2 point to a high tendency for buried lies, and values above about 2.4 kg/cm2 point to a low tendency. Labs often test both dry and wet samples, because moisture changes firmness.
How to use it
Neither of the Jackson Sand reports quoted in this article lists particle shape or a penetrometer value. If fried-egg lies are your main complaint, ask for those tests specifically, and read them alongside grading: a broader grading like Tennessee White’s and a more angular shape both push toward a firmer surface. Remember too that depth is a big factor. Keep at least 4 inches on floors; overfilled floors play soft regardless of the penetrometer reading.
Crusting Potential, pH, Hardness and Color
Crusting potential
Some labs rate crusting potential directly, often on a scale from none to severe, by wetting and drying a sample and checking the surface. Crusting is driven mostly by silt, clay and very fine sand. With fines of 0.3% combined for Tennessee White and under 1% each for Regular, plus low very fine sand in both, crusting potential should be low. If a report shows a crusting rating of moderate or worse, expect surface skins after storms.
Chemical reaction (pH) and hardness
Some sands, especially those containing calcium carbonate, react chemically. They can raise pH in adjacent turf where sand splashes, and they can cement slightly over time. Soft particles also break down under traffic and raking, slowly creating their own fines. A good report notes pH and, where relevant, an acid reaction or hardness rating. Hard, chemically stable grains hold their grading for years.
Color
Color is not a performance factor, but it matters to how a course looks and how maintenance is perceived. Labs or suppliers may describe color with a standard color chart reading. A bright white sand like Tennessee White shows contamination and wear more readily than a natural-toned sand like Regular Bunker Sand. Choose color knowing the maintenance it implies.
Overall playing quality
The seventh factor is a judgment that combines the other six. Some labs give a summary rating. Others leave it to the agronomist. Either way, it should match what the numbers say: clean, well-sized, stable sand with a reasonable penetrometer value should play well.
Infiltration Rate and How It Changes Over Time
Infiltration rate measures how fast water moves through a compacted sample, usually reported in inches per hour. It is the number most directly tied to how fast a bunker recovers after a storm.
Infiltration depends on the factors above: fines, the size of the smallest particles (reflected in D10), uniformity and packing. A clean, uniform, medium-centered sand typically infiltrates very fast. Add silt, clay or a lot of very fine sand and the rate drops.
Lab rate versus field rate
A lab number describes new, clean sand under controlled conditions. In the field, bunker sand works as a filter and degrades. One documented example saw infiltration fall from 24 to 12 inches per hour in three years, while organic matter rose from about 0.3% to roughly 1%. Nothing was wrong with the original sand. It simply collected soil, clippings and debris.
What to do with the number
- Use the lab rate to compare candidate sands on an equal footing.
- Record a field infiltration test after installation to set your baseline.
- Retest every few years, and send a sample back to the lab to check fines and organic matter.
- Protect the rate by fixing surrounds that wash into bunkers; turf slopes generally need at least 2% fall to shed water.
When infiltration falls well below the baseline and fines or organic matter have climbed, it is time to plan replacement rather than keep topping up contaminated sand. Jackson Sand’s golf course maintenance resources cover bunker upkeep alongside aeration and top dressing.
A Quick Checklist and Getting the Full Reports
Here is the two-minute read for any bunker sand report:
- Silt and clay: as low as possible. Both Jackson Sand bunker sands are at or under 1% each.
- Coarse plus medium (0.25 to 1.0 mm): at least 65%. Regular is 78.6%; Tennessee White is 73.5%.
- Tails: very little gravel or very coarse sand at the top, very little very fine sand at the bottom.
- D85: needed if sand sits over gravel. Regular is 0.49 mm.
- Cu: low means uniform and fast draining; higher means firmer but watch fines. Regular is 2.0.
- Shape and penetrometer: ask for them if buried lies are a concern.
- Crusting, pH, hardness, infiltration: confirm stability and drainage.
- Source: confirm the report comes from an accredited physical soil testing lab.
Jackson Sand has been producing sand since about 1996 and turned to golf-course-grade bunker sands, top dressings and root zone mixes around 1998. Its washing plant in Jackson, Tennessee now has capacity of up to 150,000 tons a year, and its own fleet of roughly 14 trucks delivers clean material from Huntsville, Alabama to Little Rock and Owensboro, Kentucky. Because the company runs its own trucks, the sand you receive should match the report you read.
To get current full lab reports for Regular Bunker Sand or Tennessee White Bunker Sand, or to talk through a spec, call 731-668-0440 or reach the team through the contact page.
Inside the Jackson Sand Plant
Take a 90-second look at where our sand comes from: the washing plant, screens and conveyors, and the Jackson Sand truck fleet that delivers every load. President Carlton Pope tells the story of how the company grew from one truck in 1996.
Sources and Further Reading
- physical properties that impact bunker sand performance (USGA)
- USGA guide to selecting the right bunker sand (USGA Green Section Record)
- How to Select the Best Sand for Your Bunkers (USGA, PDF) (USGA Green Section Record)
Frequently Asked Questions
What is the most important number on a bunker sand lab report?
Start with silt and clay, because fines cause crusting, slow drainage and staining. Then check the percentage of particles between 0.25 and 1.0 mm, which should be at least 65% under common bunker guidance. Jackson Sand's Regular Bunker Sand is 78.6% in that range and Tennessee White is 73.5%.
What does D85 mean on a sand report?
D85 is the particle size that 85% of the sample by weight is finer than. It describes the coarse end of the sand and is used to check whether sand will stay on top of a gravel layer. Jackson Sand's Regular Bunker Sand has a D85 of 0.49 mm.
What is a good uniformity coefficient for bunker sand?
There is no single correct value. A Cu around 2 describes a fairly uniform sand that drains fast and rakes smoothly but plays a little softer. Higher values describe broader grading that firms the surface but can slow drainage if fines are high. Read Cu together with the silt and clay numbers.
How does a penetrometer test relate to fried-egg lies?
A penetrometer measures how much force it takes to push a probe into the sand. Low readings indicate soft sand with a higher tendency for buried and fried-egg lies; higher readings indicate a firmer surface. As a rough industry guide, readings below about 2.2 kg/cm2 suggest high plugging risk.
Why does bunker sand drain slower after a few years?
Bunker sand acts as a filter, collecting soil, clippings, leaves and dust. In one documented case infiltration fell from 24 to 12 inches per hour in three years as organic matter rose from 0.3% to about 1%. Controlling washouts and testing periodically helps you time replacement.
Where should bunker sand lab results come from?
They should come from an accredited physical soil testing laboratory, which uses standardized sieve, sedimentation, infiltration and penetrometer methods. Ask your supplier for the full current report, and check that the size classes add up to about 100% before relying on the numbers.
Ready to order or have a question about the right material? Call Jackson Sand at 731-668-0440 or send us a message and we will help you pick the right product and quantity.
Leave a Reply