
Golf Course Top Dressing Sand Specs: Your 9-Point Guide to Choosing Right
Quick answer: Golf course top dressing sand specs define the physical properties — particle size distribution, shape, infiltration rate, and organic matter content — that determine whether a sand will improve or damage a putting surface. The USGA recommends medium-fine to medium sand with 60–80% of particles falling between 0.25 mm and 0.5 mm, an infiltration rate above 6 inches per hour, and less than 3% organic matter. Matching your top dressing sand to your existing root zone mix is equally critical. Jackson Sand supplies lab-tested top dressing sand to golf courses across Jackson, TN and West Tennessee, with delivery included.
1. What Are Sand Specs — and Why Do They Matter?
Before diving into individual measurements, it helps to understand what sand specs actually are and what’s at stake when they’re ignored. In the golf industry, the term covers a standardized set of laboratory measurements that predict how a sand will behave in the field — how quickly it drains, how well it resists compaction, and whether it will bond cleanly with the existing root zone. Every number on a spec sheet tells a story about long-term playing surface health.
Defining 'Sand Specs' in a Turf Context
Sand specifications (commonly called “sand specs”) are a set of measurable physical and chemical properties that describe a sand sample. For golf course use, these properties are tested in a laboratory and reported on a spec sheet that lets superintendents compare products objectively before a single grain hits the green. Key properties include particle size distribution, particle shape, bulk density, infiltration rate, and organic matter content.
Without specs, you’re guessing. Two bags of sand that look identical to the naked eye can perform completely differently under a mower — one draining freely after a rain event, the other compacting into a crust that smothers turf roots within a single growing season.
The Cost of Getting It Wrong
Using off-spec sand for top dressing is one of the most expensive mistakes a superintendent can make. Research from the Golf Course Superintendents Association of America (GCSAA) consistently shows that layering — the formation of distinct, contrasting soil strata — is a leading cause of poor drainage and localized dry spots on greens. Layering almost always traces back to inconsistent sand specs applied over multiple seasons.
A single top dressing event with the wrong particle size can create a fine-textured layer that acts like a sponge above a coarser root zone, holding perched water and promoting anaerobic conditions. Repairing that damage typically requires aggressive aeration or, in severe cases, green reconstruction — costs that dwarf the price difference between spec-matched and off-spec sand.
2. Particle Size Distribution — the Most Important Spec
Of all the numbers on a sand spec sheet, particle size distribution carries the most weight. It governs drainage, aeration, compaction resistance, and how well the new sand integrates with the existing root zone profile. Get this one right and most other properties tend to follow; get it wrong and no amount of cultural practice will fully compensate.
How Particle Size Is Measured
Particle size distribution (PSD) is determined by a mechanical sieve analysis. A dried sand sample is passed through a stacked series of wire-mesh sieves with progressively smaller openings, and the percentage of material retained on each sieve is recorded. Results are expressed as a cumulative percentage curve or a table of size fractions.
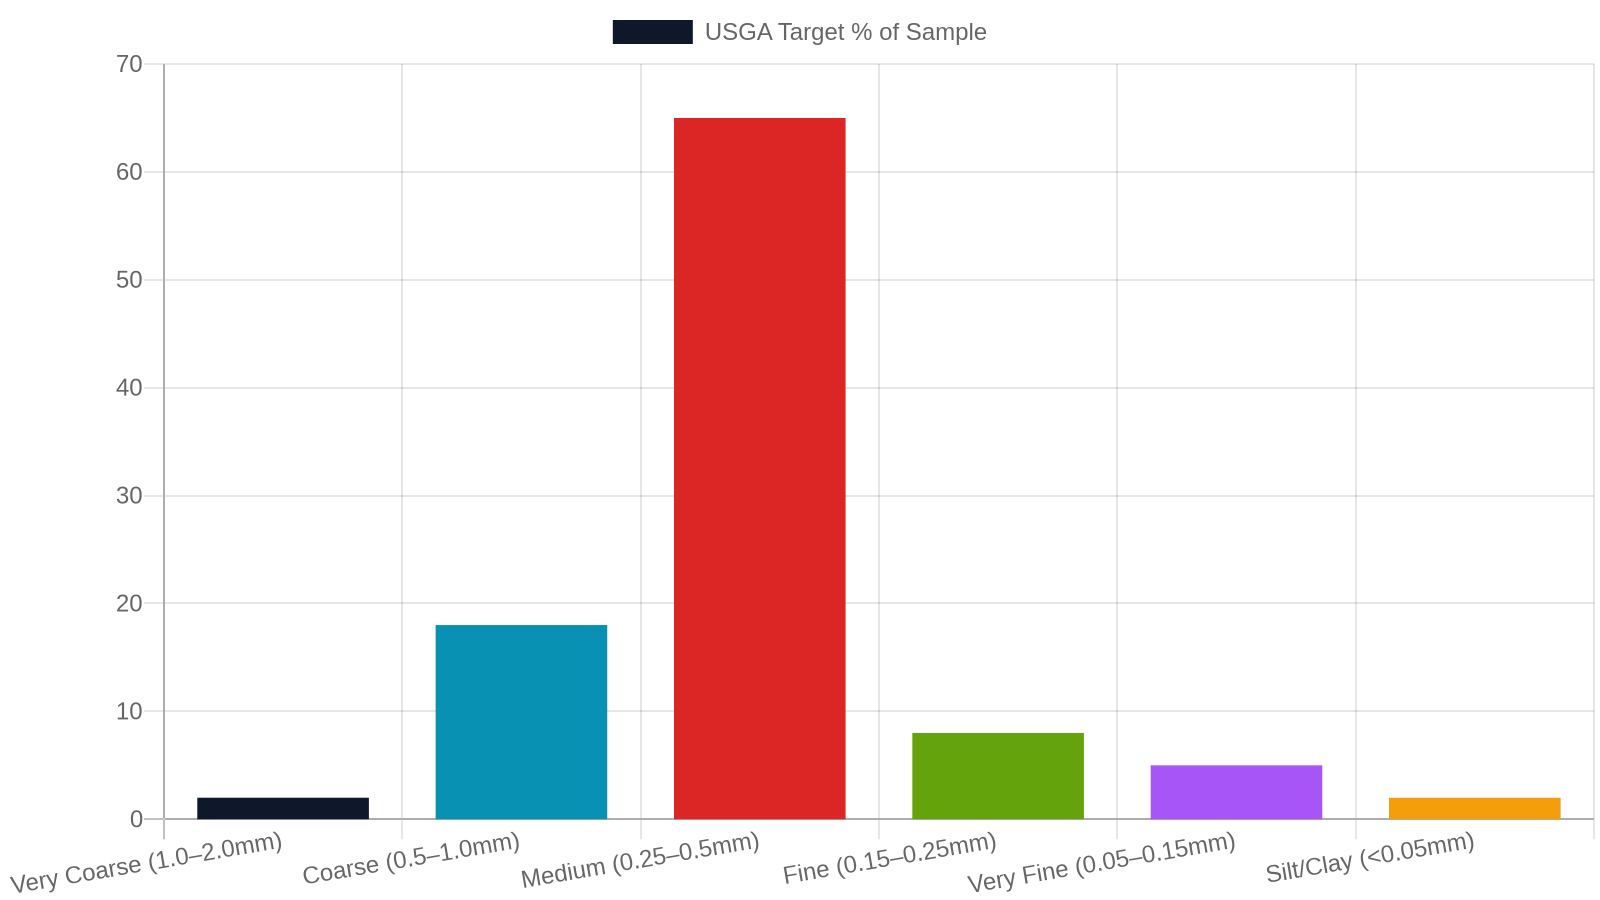
The USGA classifies sand particles into six size categories relevant to putting green construction and maintenance:
- Very coarse: 1.0–2.0 mm
- Coarse: 0.5–1.0 mm
- Medium: 0.25–0.5 mm
- Fine: 0.15–0.25 mm
- Very fine: 0.05–0.15 mm
- Silt/clay: below 0.05 mm
USGA Particle Size Targets for Top Dressing Sand
The USGA Method recommends that at least 60% of particles fall in the medium to coarse sand range (0.25–1.0 mm), with the majority concentrated in the medium fraction (0.25–0.5 mm). Critically, the combined percentage of fine, very fine, and silt/clay particles should not exceed 10%, and silt plus clay alone should stay below 5%.
These thresholds exist because fine particles fill pore spaces between coarser grains, reducing the macro-porosity that allows water and air to move freely through the root zone. Even a 2–3% increase in the fine fraction can cut infiltration rates by 30% or more over time as the profile settles and organic matter accumulates.
For top dressing specifically, the target is to match — not contrast — the particle size of the existing root zone. If your green was built to USGA spec with a medium sand, your top dressing sand should fall within ±0.1 mm of that median particle size.
3. Particle Shape — Round vs. Angular
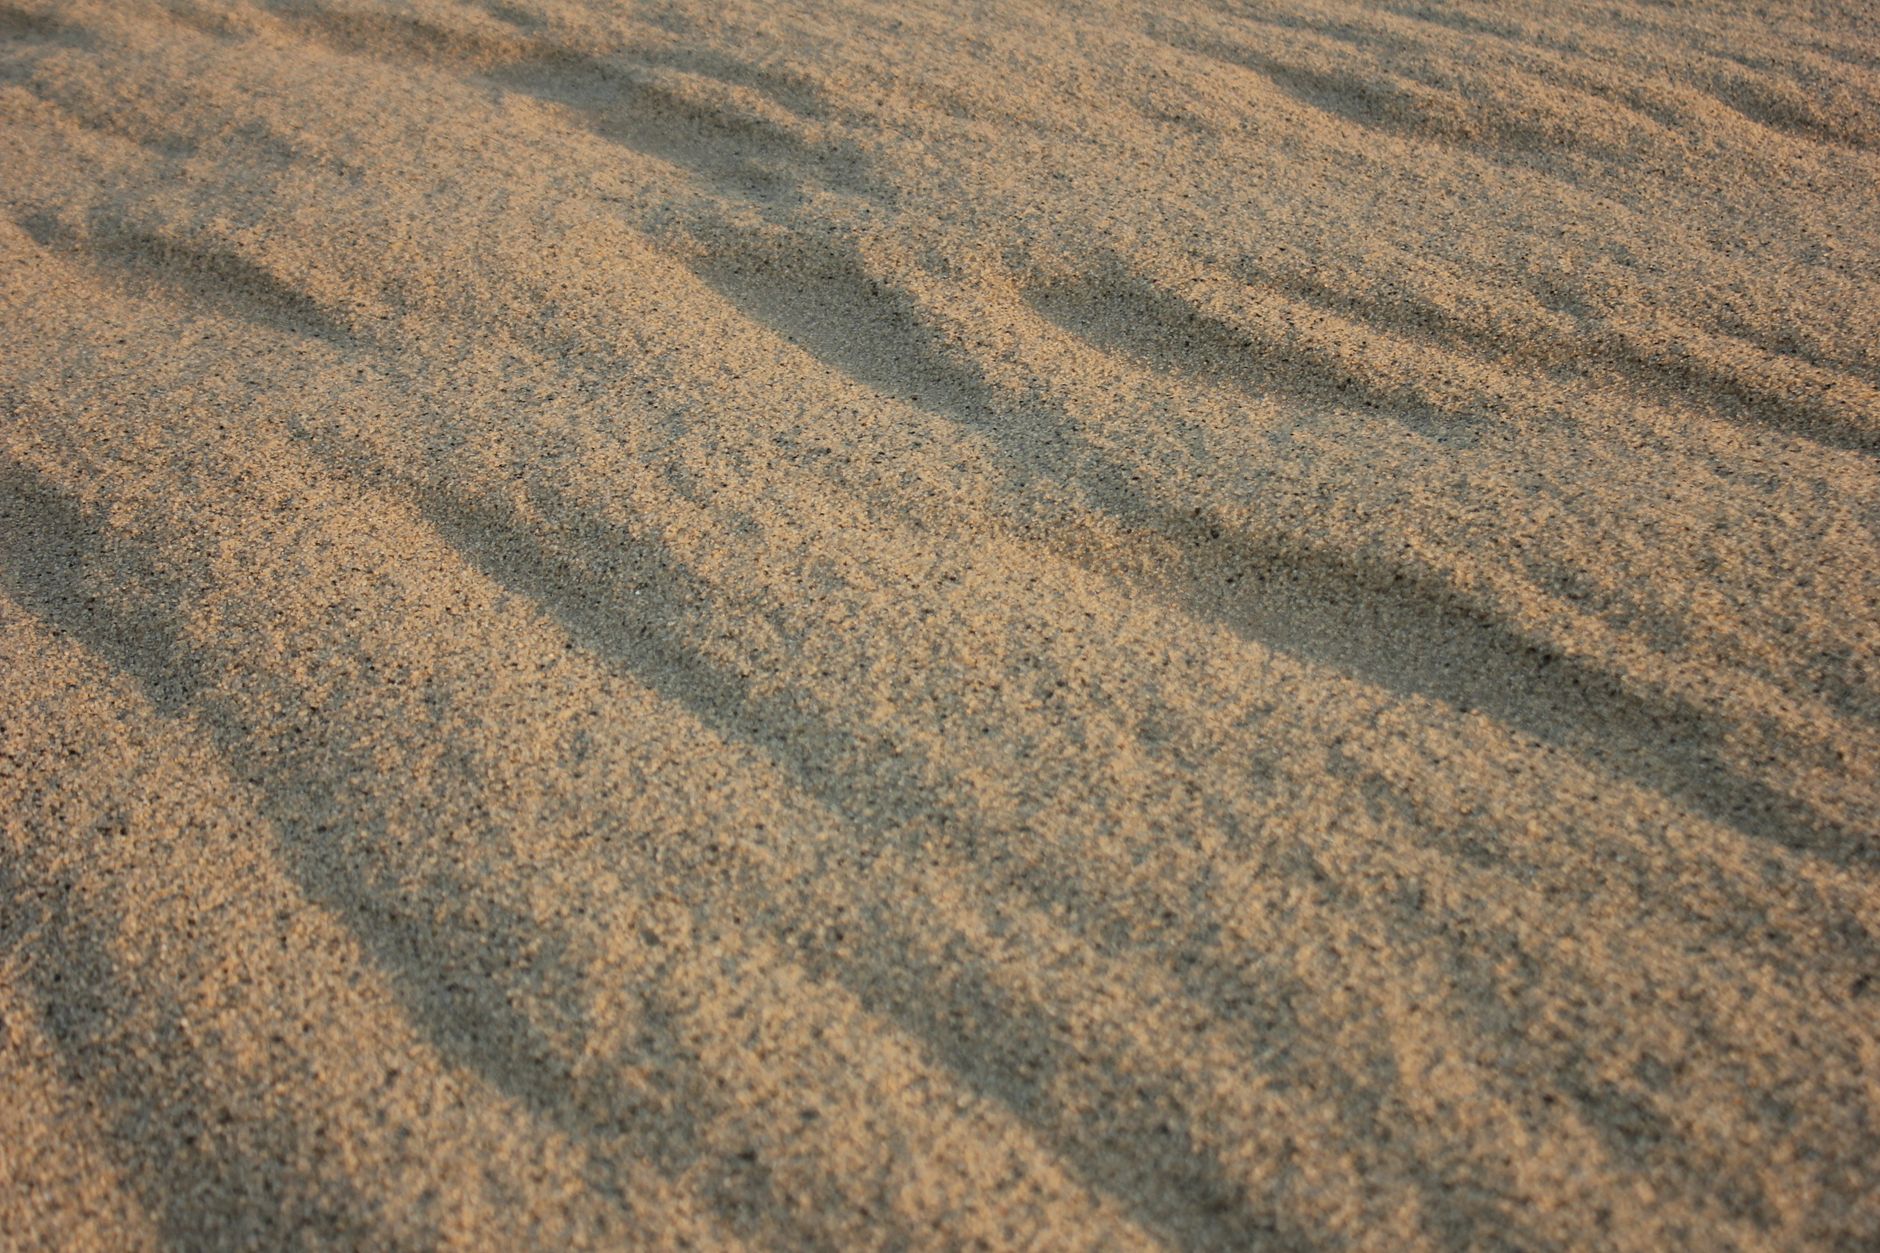
Particle size gets most of the attention, but particle shape is a close second in importance. Shape determines how grains nest against each other, which directly affects pore space, compaction potential, drainage, and even how the surface plays. A sand with perfect size distribution but the wrong shape can still underperform.
Why Shape Affects Playability
Sand grains are not all the same shape. Under a hand lens or microscope, grains range from rounded (smooth, spherical) to sub-angular (slightly faceted) to angular (sharp, irregular edges). Shape affects how grains pack together, how they feel underfoot, and how they interact with mower blades and ball roll.
Rounded grains pack loosely, creating larger pore spaces and better drainage — which is why the USGA recommends rounded to sub-rounded particles for putting green construction. However, highly rounded grains can feel “loose” in bunkers and may shift under foot traffic on slopes.
Shape Ratings and What to Look For
Particle shape is typically rated on a visual scale from 1 (perfectly rounded) to 9 (very angular), or described qualitatively as rounded, sub-rounded, sub-angular, or angular. For top dressing sand on putting greens, a shape rating of 1–3 (rounded to sub-rounded) is preferred.
Angular sands compact more readily under roller and mower traffic, reducing pore space over time. They also cause faster wear on mower reels — a maintenance cost that adds up quickly over a season of daily cutting. When reviewing a spec sheet, look for the shape descriptor alongside the sieve data. If it isn’t listed, ask the supplier for it explicitly.
4. Infiltration Rate — How Fast Water Moves Through
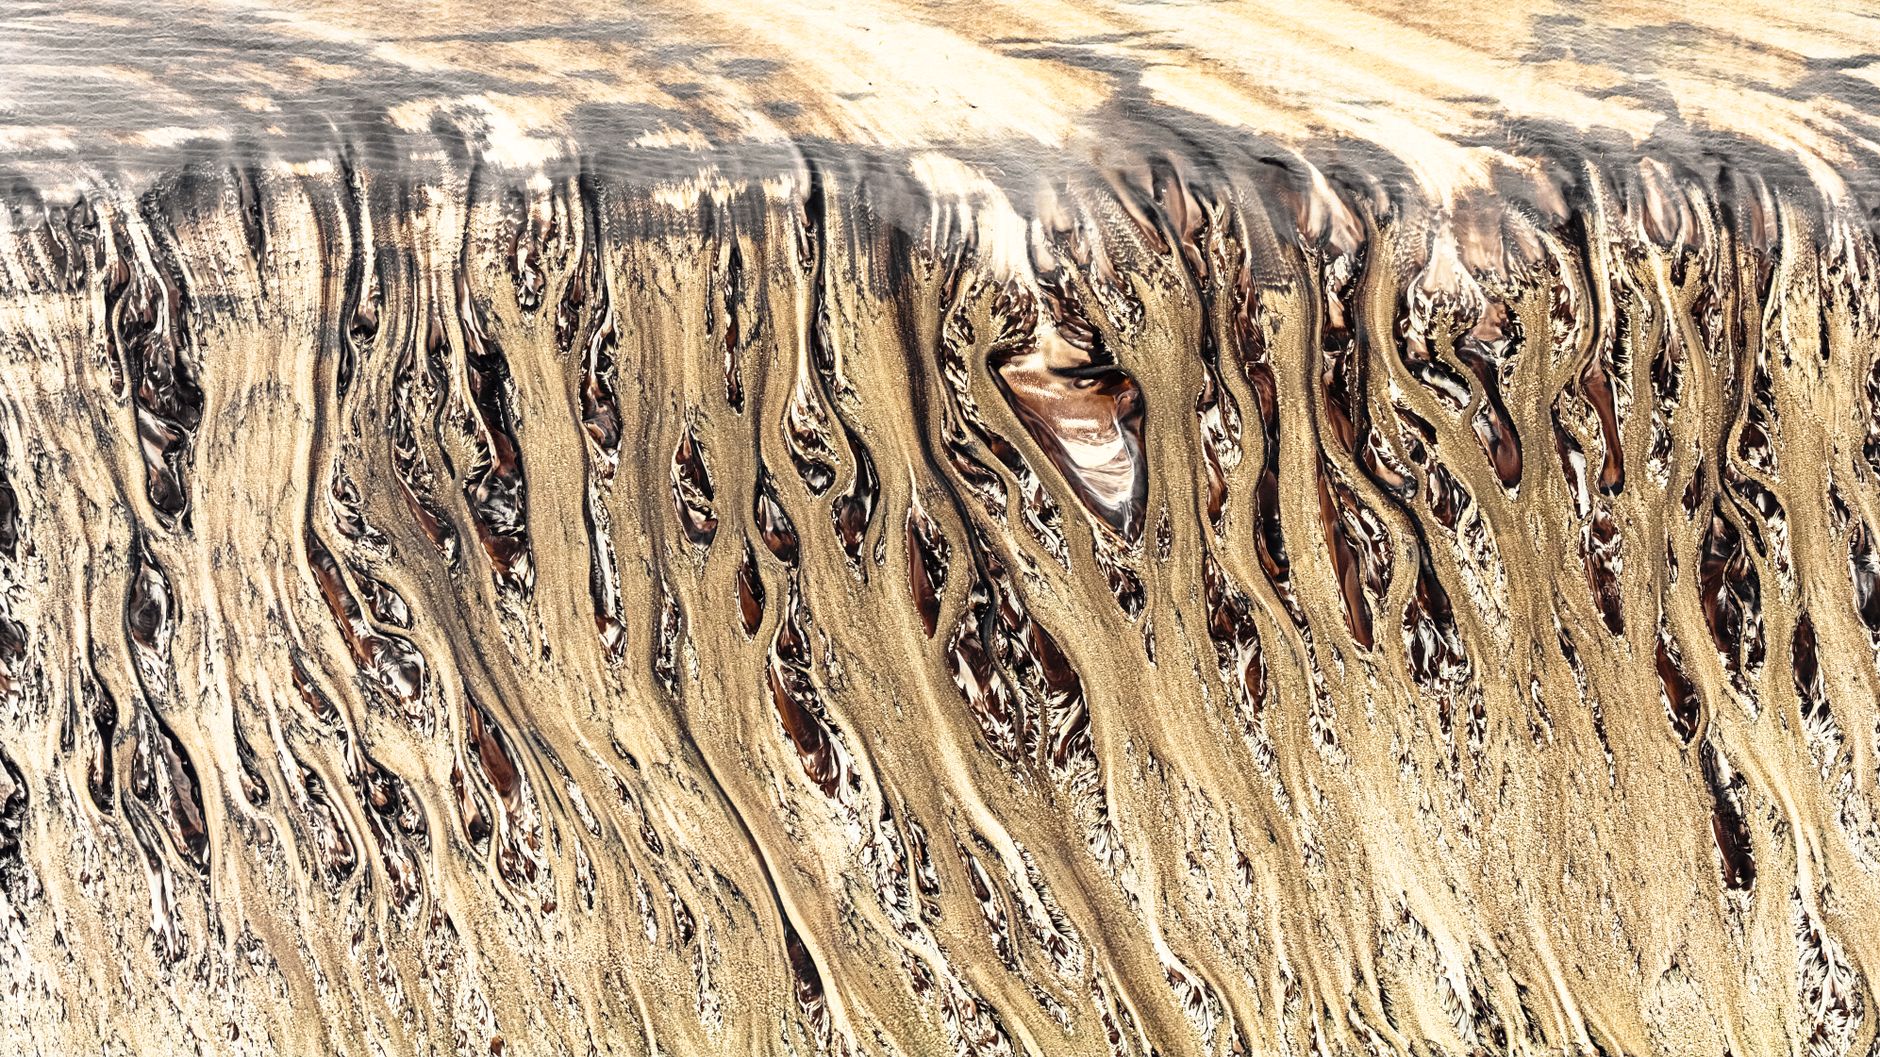
A beautiful particle size distribution means nothing if water can’t move through the profile quickly enough to prevent waterlogging. Infiltration rate is the spec that translates all those grain-size numbers into real-world drainage performance — and it’s the one that most directly affects playability after a rain event.
What Infiltration Rate Means
Infiltration rate (also called hydraulic conductivity or saturated hydraulic conductivity) measures how quickly water moves through a saturated sand sample under a defined pressure head. It is expressed in inches per hour (in/hr) or centimeters per hour (cm/hr) and is tested in the lab using a constant-head permeameter.
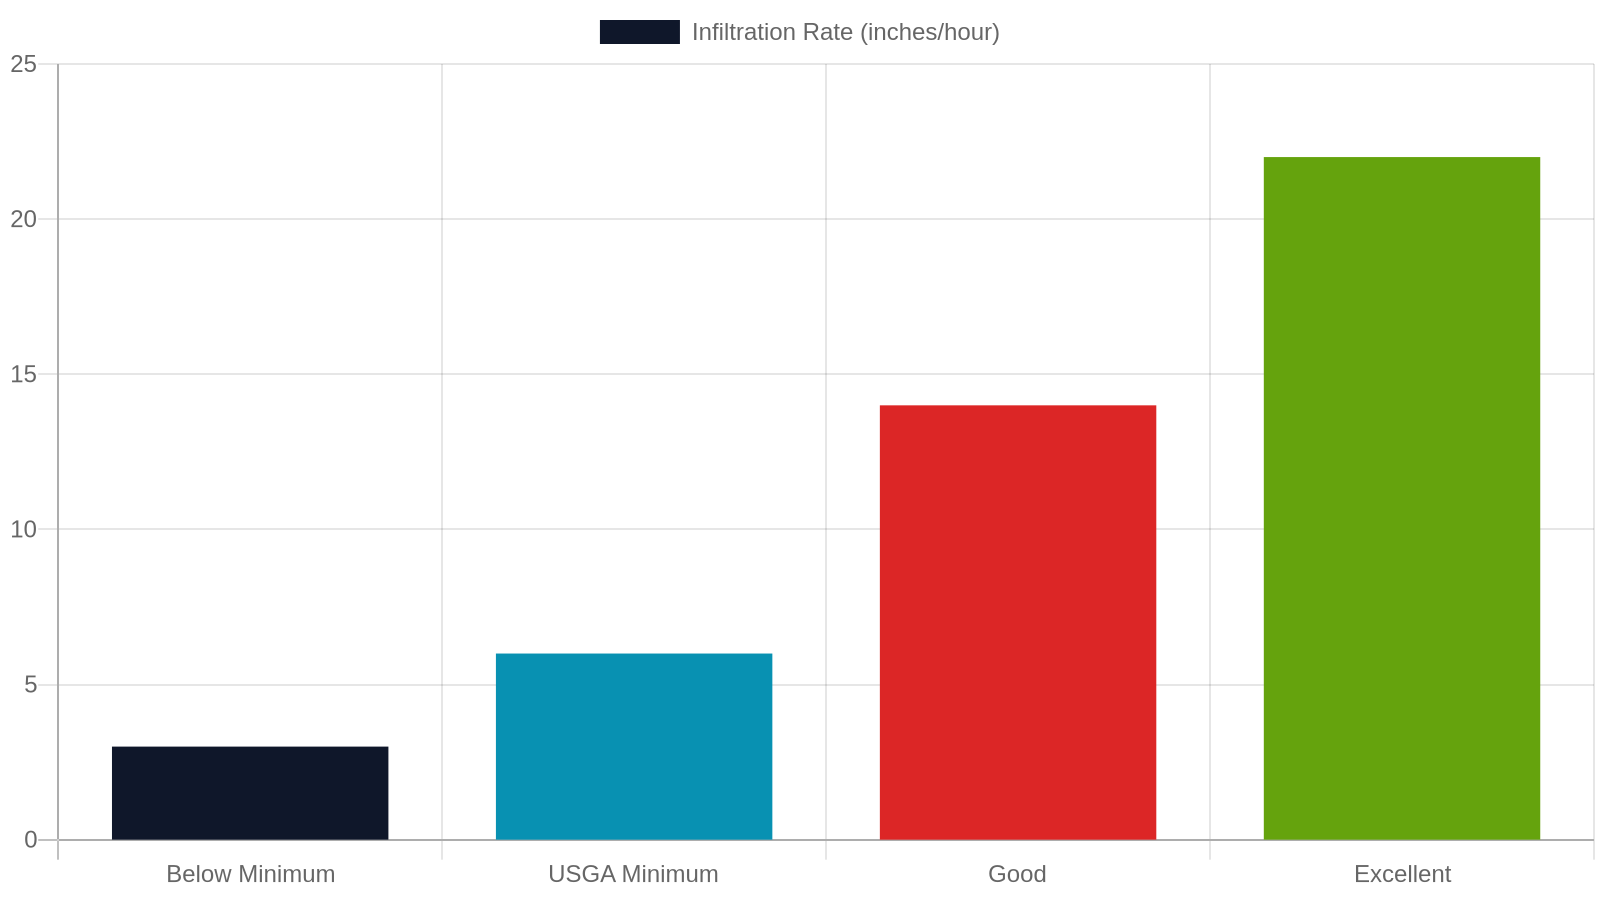
The USGA recommends a minimum infiltration rate of 6 inches per hour (15 cm/hr) for putting green root zones, with 12–24 in/hr considered excellent. Top dressing sand should match or exceed the infiltration rate of the existing root zone — adding slower-draining sand on top of a fast-draining profile creates the perched water table effect described earlier.
How Infiltration Rate Changes Over Time
Fresh sand almost always tests well above the minimum threshold. The challenge is maintaining that rate as the profile ages. Organic matter from thatch decomposition, fine particles carried in by irrigation water, and biological activity all gradually fill macro-pores and reduce hydraulic conductivity.
Studies published in the International Turfgrass Society Research Journal show that infiltration rates on sand-based greens can drop by 40–60% within five years of construction without aggressive aeration and top dressing programs. This is precisely why consistent, spec-matched top dressing is not optional — it’s the primary tool superintendents have to dilute organic matter and maintain drainage capacity year over year.
5. Organic Matter Content — Keeping It Low
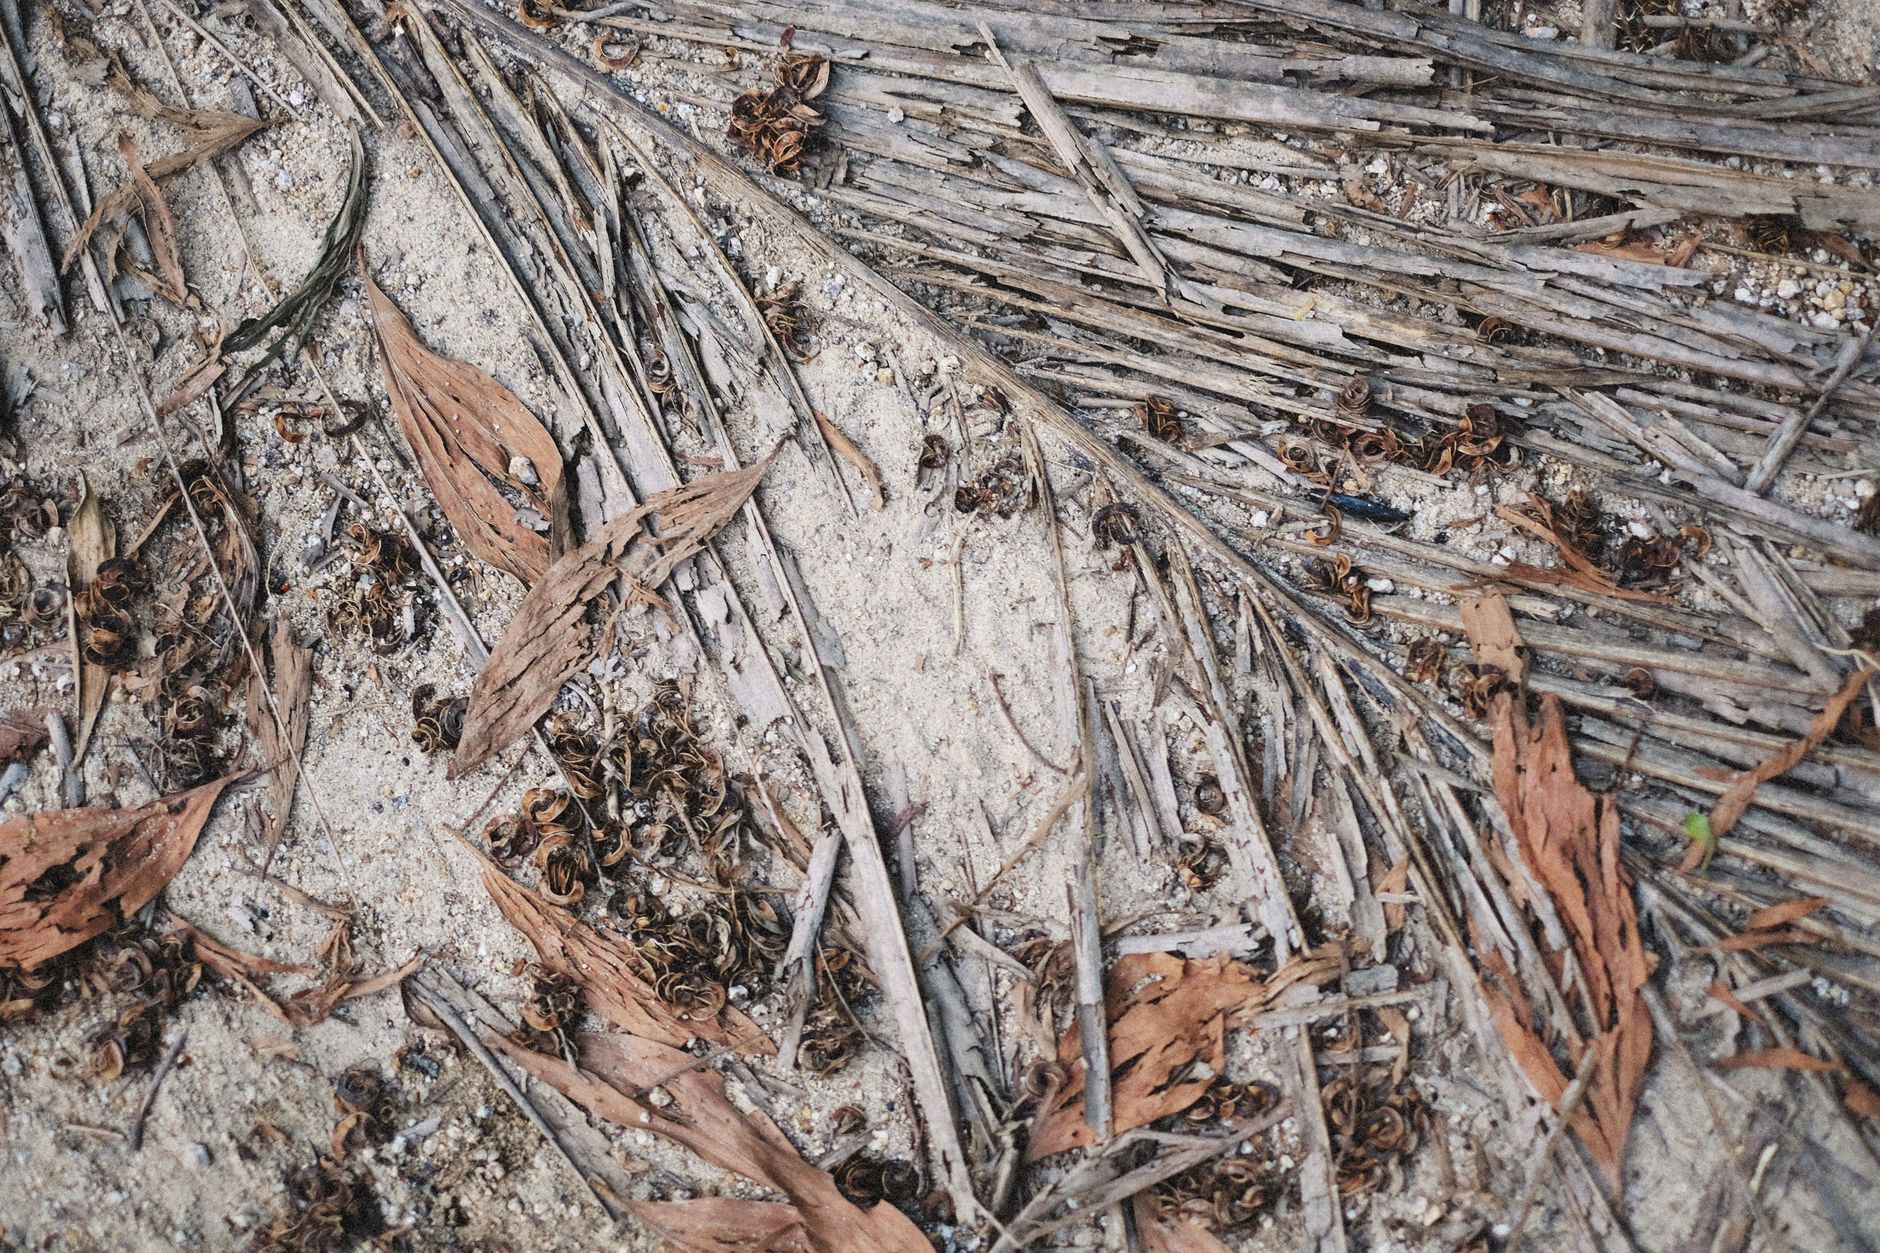
Organic matter content is the spec that most directly connects your top dressing program to long-term green health. Even a perfectly sized, perfectly shaped sand will underperform if it carries significant organic matter — and the organic matter already in your profile will compound the problem every season if it isn’t actively managed.
Why Organic Matter Is the Enemy of Drainage
Organic matter (OM) in a sand-based root zone comes from decomposing plant material — roots, thatch, and clippings that work their way into the profile. It is measured as a percentage of dry weight by loss-on-ignition (LOI) testing. While organic matter is essential for soil biology in native soil systems, it is actively harmful in a sand-based putting green root zone above very low thresholds.
The USGA recommends that organic matter in the top 4 inches of a putting green root zone stay below 3.5% — ideally between 1% and 3%. Above 3.5%, the profile begins to exhibit reduced drainage, increased disease pressure, and inconsistent ball roll. Above 5%, many superintendents report severe localized dry spots and summer stress events even with aggressive irrigation.
Top Dressing as an OM Dilution Tool
The primary reason golf courses top dress is not to smooth the surface — it’s to dilute organic matter accumulation. Each application of clean, low-OM sand buries a thin layer of organic material and physically separates it from the surface where it would otherwise mat and restrict airflow.
Research from Penn State’s Center for Sports Surface Research suggests that greens receiving light, frequent top dressing (1–2 lbs of sand per 1,000 sq ft every 7–14 days during the growing season) accumulate organic matter at roughly half the rate of greens that rely solely on core aeration. The sand itself must have near-zero organic matter content — typically less than 0.5% — to function as an effective dilution agent.
6. Bulk Density and Pore Space — the Hidden Numbers
Bulk density and pore space are often overlooked by superintendents focused on particle size, but they are the specs that most directly predict root zone aeration. A sand can pass every size test and still compact into a dense, poorly aerated layer if its bulk density is too high — starving roots of the oxygen they need to sustain healthy turf through summer stress.
What Bulk Density Tells You
Bulk density is the mass of a dry sand sample divided by its total volume (including pore space), expressed in grams per cubic centimeter (g/cm³). For golf course sands, typical values range from 1.4 to 1.7 g/cm³. Lower bulk density generally indicates more pore space — which means better drainage and more room for air and roots.
The USGA recommends total porosity (the percentage of volume that is pore space) of 35–55% for putting green root zones, with at least 15% of that being macro-pores (pores large enough to drain freely by gravity). A sand with bulk density above 1.7 g/cm³ is likely too dense to meet these targets without amendment.
Air-Filled Porosity and Root Health
Air-filled porosity (AFP) is the percentage of the root zone volume occupied by air after the profile has drained to field capacity. The USGA targets a minimum AFP of 15%. Below that threshold, turf roots experience oxygen stress — a condition that weakens the plant and makes it susceptible to disease, especially during hot, humid West Tennessee summers when soil respiration rates are highest.
Matching the bulk density of your top dressing sand to your root zone mix ensures that each application integrates smoothly rather than creating a denser or lighter layer that disrupts water and air movement through the profile.
7. Matching Top Dressing Sand to Your Existing Root Zone

Understanding individual specs is only half the job. The other half is knowing how to compare those specs to what’s already in the ground. A top dressing program that ignores the existing root zone profile is flying blind — and the consequences show up slowly, over seasons, before most superintendents realize what’s happening.
Why Consistency Is More Important Than Perfection
There is no universally “best” top dressing sand — there is only the best sand for your specific green. A medium sand that performs brilliantly on a USGA-spec green built in 2018 may cause severe layering on a push-up green from the 1970s. The goal is not to hit an abstract ideal but to match the existing profile as closely as possible.
Before ordering top dressing sand, pull a soil core from your green and have it analyzed. The lab report will tell you the median particle size, shape, and infiltration rate of your current root zone. Use those numbers as your target when evaluating supplier spec sheets — look for a top dressing sand whose median particle size falls within 0.05 mm of your existing profile’s median.
When to Intentionally Deviate from the Existing Profile
There are situations where a superintendent deliberately chooses a slightly different top dressing sand to correct a problem in the existing profile. For example, if organic matter accumulation has created a fine-textured, slow-draining layer in the top 2 inches, a slightly coarser top dressing sand applied aggressively over two to three seasons can help open the profile and improve drainage.
This strategy requires careful monitoring and should be backed by annual soil testing. Moving too far from the existing profile too quickly can create the very layering problem you’re trying to solve. Work with your sand supplier to review spec sheets and develop a multi-season plan rather than making a single large change.
Top Dressing Sand Specs at a Glance: USGA Targets vs. Common Red Flags
Use this table to quickly evaluate any sand spec sheet against USGA recommendations. Values in the 'Red Flag' column indicate material that is likely to cause drainage problems, layering, or turf stress over time.
8. Reading a Sand Spec Sheet — Line by Line

Even superintendents who understand sand specs sometimes struggle to translate a lab report into a purchasing decision. Knowing what every line means — and what to look for as a red flag — turns a spec sheet from a formality into a powerful quality-control tool. Jackson Sand publishes lab-tested spec sheets for all products; you can review our current sand specs before placing an order.
What a Complete Spec Sheet Should Include
A reputable sand supplier should provide a lab-tested spec sheet for every product they sell for golf course use. A complete spec sheet includes: particle size distribution (full sieve analysis table), particle shape descriptor, saturated hydraulic conductivity (infiltration rate), bulk density, total porosity, air-filled porosity, organic matter content, and Atterberg limits (plasticity index — important for confirming the sand has no clay-like behavior).
Some labs also report uniformity coefficient (D60/D10 ratio), which measures how spread out the particle size distribution is. The USGA recommends a uniformity coefficient below 3.5 for putting green sands — a tighter distribution means more consistent pore space throughout the profile.
Red Flags on a Spec Sheet
When reviewing a spec sheet, watch for these warning signs:
- High fine fraction: More than 10% of particles finer than 0.25 mm is a drainage risk.
- Elevated silt/clay: Any silt or clay above 3% will cause compaction and drainage problems over time.
- Low infiltration rate: Below 6 in/hr fails the USGA minimum threshold.
- High organic matter: Above 0.5% in the sand itself means you’re adding OM with every application.
- No test date: Sand quarries can change over time. A spec sheet older than 12 months may not represent current production.
- Missing plasticity index: Without this, you can’t confirm the absence of clay minerals that behave like silt under pressure.
9. Top Dressing Frequency, Rates, and Timing
Choosing the right sand is only part of the equation. How much you apply, how often, and when during the season determines whether your top dressing program actually improves the profile or just adds cost without benefit. The best spec-matched sand in the world won’t help if it’s applied at the wrong rate or at the wrong time of year.
Light and Frequent vs. Heavy and Infrequent
The industry has largely moved away from heavy, infrequent top dressing events (often associated with core aeration backfill) toward light, frequent applications during the growing season. Research supports applying 0.5–2 lbs of sand per 1,000 sq ft every 7–14 days during active growth, rather than 10–15 lbs per 1,000 sq ft two or three times per year.
Light, frequent top dressing keeps organic matter dilution continuous, minimizes surface disruption, and allows sand to work into the canopy without smothering turf. It also requires less aggressive brushing and reduces the recovery time between applications and play.
Seasonal Timing Considerations in West Tennessee
In West Tennessee’s humid subtropical climate, the primary top dressing season for bermudagrass greens runs from late April through September, when active growth allows the turf to recover quickly between applications. Avoid heavy top dressing within two weeks of anticipated frost, as sand on a dormant surface can cause uneven winter damage.
For overseeded greens, coordinate top dressing with your overseeding schedule — typically pausing heavy applications in late September to allow ryegrass establishment, then resuming light applications once the stand is established in November. Spring transition is another critical window; light top dressing in March and April helps bermudagrass push through the overseeded stand more evenly.
10. Calculating How Much Sand You Need

Once you’ve confirmed the right sand spec, the next question is how much to order. Underestimating means running out mid-program; overestimating ties up budget and storage space. Getting quantities right is a practical skill that pays for itself every season — and it starts with knowing your green area and target application depth.
The Math Behind Top Dressing Quantities
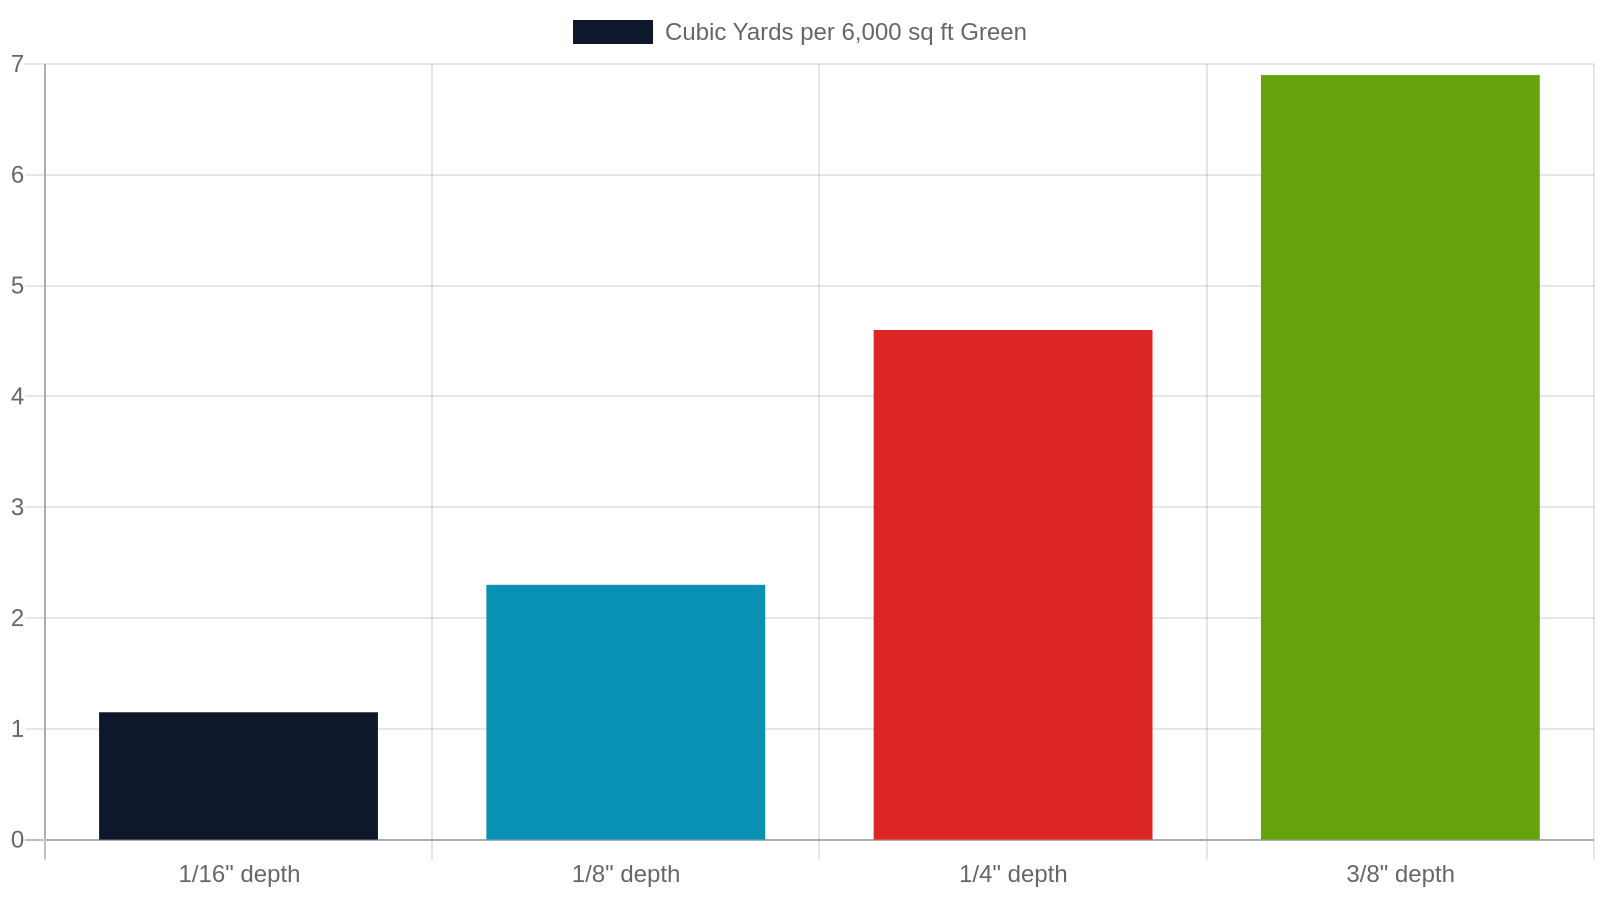
Top dressing quantities are calculated based on the area to be covered and the desired application depth. For light, frequent applications, the target depth is typically 1/16 to 1/8 inch per event. For post-aeration backfill, the target is enough sand to fill the core holes — usually 1/4 to 3/8 inch equivalent depth.
The formula is straightforward: Area (sq ft) × Depth (ft) = Volume (cubic feet). Divide by 27 to convert to cubic yards. For example, a 6,000 sq ft green receiving a 1/8-inch (0.0104 ft) application needs approximately 2.3 cubic yards of sand per event. Over a 20-week growing season with bi-weekly applications, that’s roughly 23 cubic yards per green — a meaningful volume to plan and budget for.
Using a Yardage Calculator to Plan Orders
Manual calculations are prone to error, especially when you’re managing multiple greens, tees, and fairway approaches with different areas and application rates. A yardage calculator eliminates the math and helps you place accurate orders — avoiding both costly over-ordering and the operational disruption of running short mid-season.
Jackson Sand offers a free online yardage calculator on our website. Enter your area and desired depth and it returns the cubic yards you need. Accurate quantities also mean cleaner, more consistent loads — something we can ensure because we mix our own sand on premises and deliver in our own trucks.
Ready to Order Spec-Matched Top Dressing Sand in West Tennessee?
Choosing the right top dressing sand is a technical decision — but it doesn’t have to be a complicated one. With lab-tested spec sheets, a free yardage calculator, and a team that mixes and delivers its own product, Jackson Sand makes it straightforward for golf course superintendents and turf managers across West Tennessee to get the right material, in the right quantity, on the right schedule.
What Sets Jackson Sand Apart
Jackson Sand mixes its own sand on premises at 139 United Dr., Jackson, TN 38305 — which means every load is blended to consistent spec rather than pulled from a stockpile of variable material. We own our delivery trucks, so loads arrive clean, accurate, and on schedule without third-party handling that can introduce contamination or short weights.
We serve golf courses, athletic fields, schools, parks departments, contractors, and homeowners across West Tennessee and the Mid-South. Whether you need a single load for a small project or a season-long supply contract for a multi-course operation, delivery is included in every order.
Your Next Step
Start by reviewing our published lab results — our sand specs page gives you the full particle size distribution, infiltration rate, and organic matter data for our top dressing and golf course sand products. Compare those numbers to your existing root zone analysis and you’ll have everything you need to make a confident purchasing decision.
When you’re ready to talk quantities, application schedules, or product selection, call us at 731-668-0440. Our team understands turf — we’re not just delivering sand, we’re helping you maintain a playing surface that performs all season long. You can also explore our full range of golf course sand products or learn more about our top dressing services for courses that want hands-on help, not just a delivery.
Frequently Asked Questions
What particle size should top dressing sand be for golf greens?
The USGA recommends medium sand with 60–80% of particles falling between 0.25 mm and 0.5 mm. Fine particles (below 0.15 mm) should make up less than 10% of the sample, and silt plus clay combined should stay below 3%. The most important rule is to match the particle size of your existing root zone as closely as possible.
How often should you top dress a golf course putting green?
Most modern turf programs favor light, frequent applications of 0.5–2 lbs of sand per 1,000 sq ft every 7–14 days during the active growing season. This approach dilutes organic matter continuously and causes less surface disruption than heavy, infrequent events. Post-aeration backfill is a separate, heavier application typically done two to four times per year.
What is the USGA infiltration rate requirement for golf course sand?
The USGA recommends a minimum saturated hydraulic conductivity (infiltration rate) of 6 inches per hour for putting green root zones. Rates of 12–24 in/hr are considered excellent. Top dressing sand should meet or exceed the infiltration rate of the existing root zone to avoid creating a slow-draining layer.
How do I know if my top dressing sand matches my existing green profile?
Pull a soil core from your green and send it to a turf lab for particle size analysis. Compare the median particle size and infiltration rate from that report to the spec sheet of the sand you're considering. The top dressing sand's median particle size should fall within 0.05–0.10 mm of your existing profile's median.
How much top dressing sand do I need for a putting green?
Calculate volume by multiplying the green's area in square feet by the application depth in feet, then divide by 27 to get cubic yards. A 6,000 sq ft green at a 1/8-inch application depth needs about 2.3 cubic yards per event. Jackson Sand's free yardage calculator at jacksonsand.com can do this math for you automatically.
Can I use the same sand for top dressing and bunker sand?
Not typically. Bunker sand is often coarser and may be more angular to provide the firm-but-yielding feel players expect. Top dressing sand needs to match the existing root zone profile precisely and should be rounded to sub-rounded in shape. Using bunker sand for top dressing can create a coarser layer that disrupts drainage and ball roll consistency.